

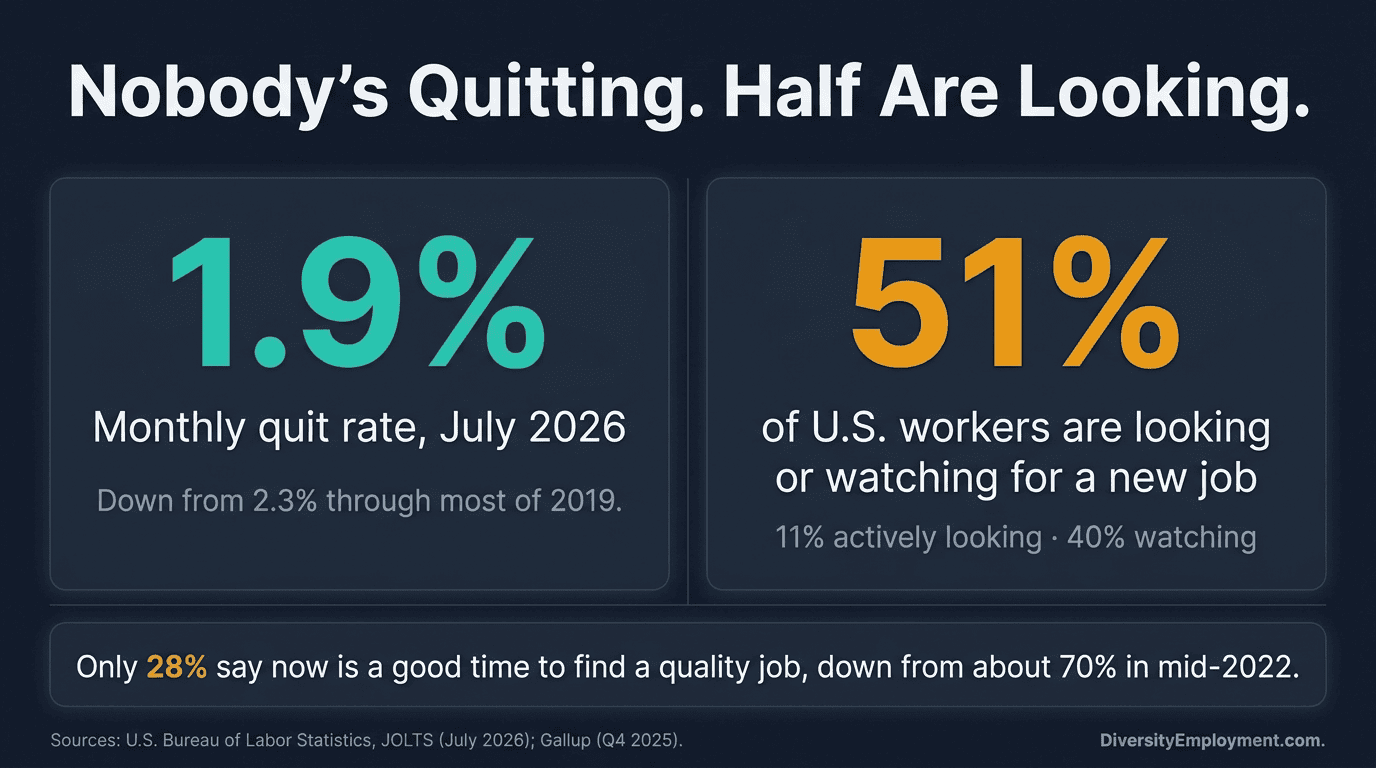
If your turnover numbers look better than they have in years, you have plenty of company. People are quitting their jobs at a rate of 1.9% a month, according to the Bureau of Labor Statistics’ July JOLTS report, well under the 2.3% that we saw through most of 2019. For a lot of HR dashboards, this is the best stretch since before the pandemic.
Now put that number up next to this one. In Gallup’s latest quarterly survey of workers, 51% said they were either actively looking for a new job, or at least watching for one. That’s close to the highest number Gallup has recorded since it started tracking in 2015. Only 28% said it was a good time to find a quality job, that’s down from about 70% in mid-2022.
Inside, Looking Out
So, more than half the workforce is considering leaving their current job, yet almost nobody is.
The hiring-side explains most of it. The hires rate was at 3.2% in July, which the Economic Policy Institute points out is the same level it averaged in 2010, when unemployment was 9.6%. Unemployment today is 4.1%. Workers are moving about as freely as they did coming out of the Great Recession, except nobody lost their job first. The exits just closed.
Which leaves every employer with low turnover, sure. But facing an uncomfortable question: “Are your people staying because they actually want to, or is it because they can’t find the way out?”
How Much of Your Retention Is Actually Yours?
Run the Check
Before you take all the credit for your retention, figure out how much of it you’d have gotten anyway. Turnover moves with the labor market, and the labor market moved a lot. A company that changed nothing between 2022 and 2025 probably still watched its turnover fall hard, because everyone’s did.
The good news is: This is measurable, and the standard is free.
The Market Did Most of the Work
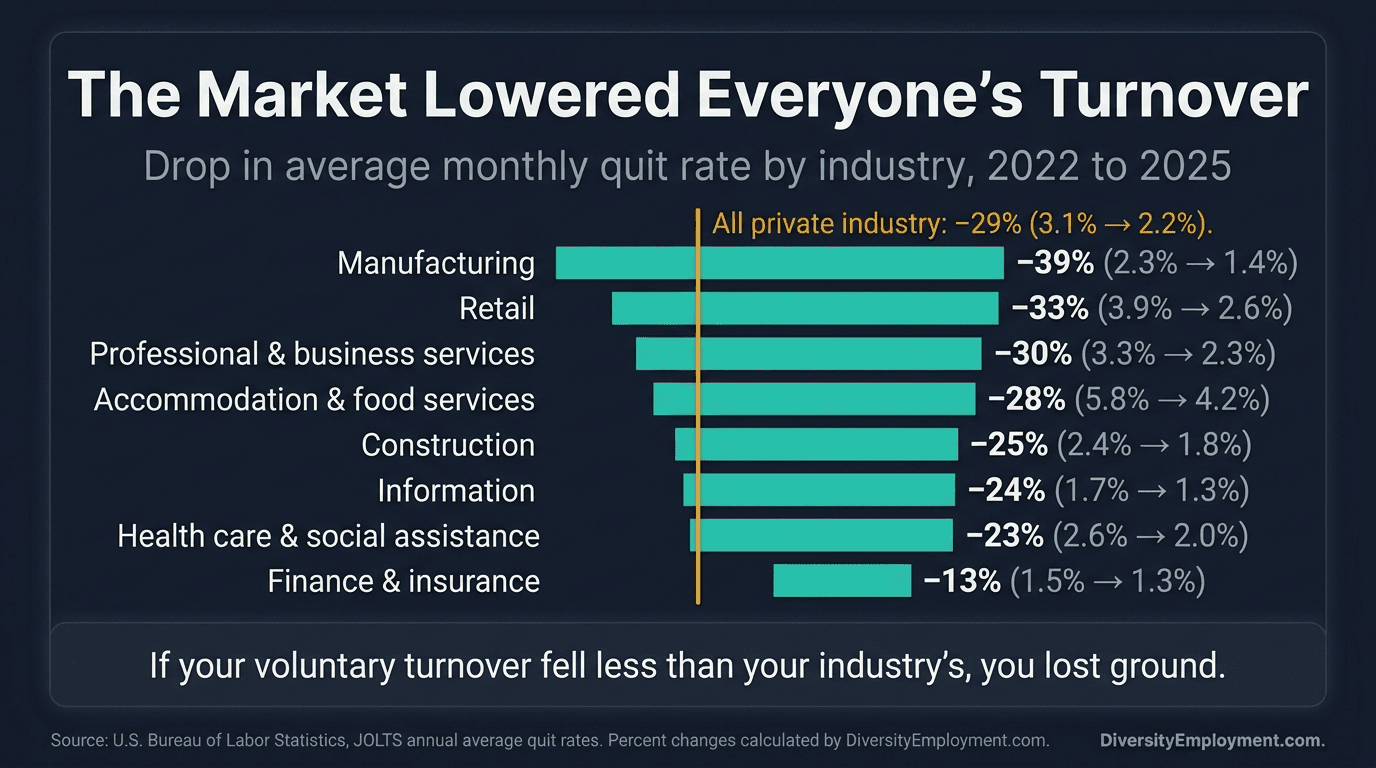
The BLS publishes annual average quit rates by industry. Compare 2022, the peak of the Great Resignation, with 2025, and the whole private sector dropped from 3.1% a month to 2.2%. That’s a 29% decline in quitting that a retention program simply can’t take credit for.
By industry, the drops from 2022 to 2025 look like this:
- Manufacturing: 2.3% to 1.4%, down 39%
- Retail: 3.9% to 2.6%, down 33%
- Professional and business services: 3.3% to 2.3%, down 30%
- Accommodation and food services: 5.8% to 4.2%, down 28%
- Construction: 2.4% to 1.8%, down 25%
- Information: 1.7% to 1.3%, down 24%
- Health care and social assistance: 2.6% to 2.0%, down 23%
- Finance and insurance: 1.5% to 1.3%, down 13%
How to Run the Math
You need three numbers:
- Your voluntary turnover rate for 2022 and for 2025 (or your most recent full year). Quits only, so leave out layoffs, firings, and retirements.
- How much the percentage changed between those two years.
- Your industry’s percentage changes from the list above.
If your quits fell faster than your industry’s, some of that improvement can genuinely be credited to you. If they fell at about the same rate, you just matched the market. And if they fell slower, you may have actually lost ground, even though your dashboards say otherwise.
A Win That Wasn’t
Take a manufacturer whose voluntary turnover dropped 35% since 2022. That probably got celebrated in a presentation deck somewhere. Against an industry that dropped 39%, though, the company slightly trailed the field. Nothing about its retention improved compared to its competitors. The market froze around them, and they happened to be standing there.
One caution. BLS rates are monthly averages, and most companies track turnover annually, so don’t compare your raw number to the BLS figure. Compare the direction and size of the change. That’s the part that tells you something.
Loyalty, Fear, or Math?
Once you’ve subtracted the market, the next question is about the people. Gallup asked workers in late 2025 why they were still in their jobs, and 43% said they stayed mainly because leaving would be too difficult or too expensive. About 30% agreed they felt stuck. A February 2026 MetLife study came at it from the other direction and found only 18% of employees planned to stay because they truly wanted to.
Researchers have a name for the people in between. “Reluctant stayers” want to leave but can’t, and they’ve been studied long enough that we know roughly what they cost. First, though, it helps to know what’s actually holding them.
What’s Holding Them
When Gallup asked the workers who felt leaving was too costly what exactly made it hard, the answers were almost entirely financial:
- 69% said they couldn’t afford to lose their current pay or benefits
- 51% said finding a comparable job would be too hard
- 36% said they depended on their current schedule or flexibility
The job hunt itself isn’t really encouraging anyone either. Nearly half of active job seekers, 49%, told Gallup their search has been a negative experience, and more than half of people who’d applied for something in the past 30 days hadn’t gotten a single interview. Workers who stay after hearing stories like that are the ones reading the market correctly.
Who feels it has shifted, too. Until recently, college graduates were the more optimistic group about the job market. That flipped… hard in 2025, and by the end of the year just 19% of college-educated workers said it was a good time to find a quality job, compared with 35% of workers without a degree. Age matters too. Among Gen Z workers, 61% are looking or watching. Among baby boomers, 74% simply aren’t looking at all.
Who’s Most Locked In
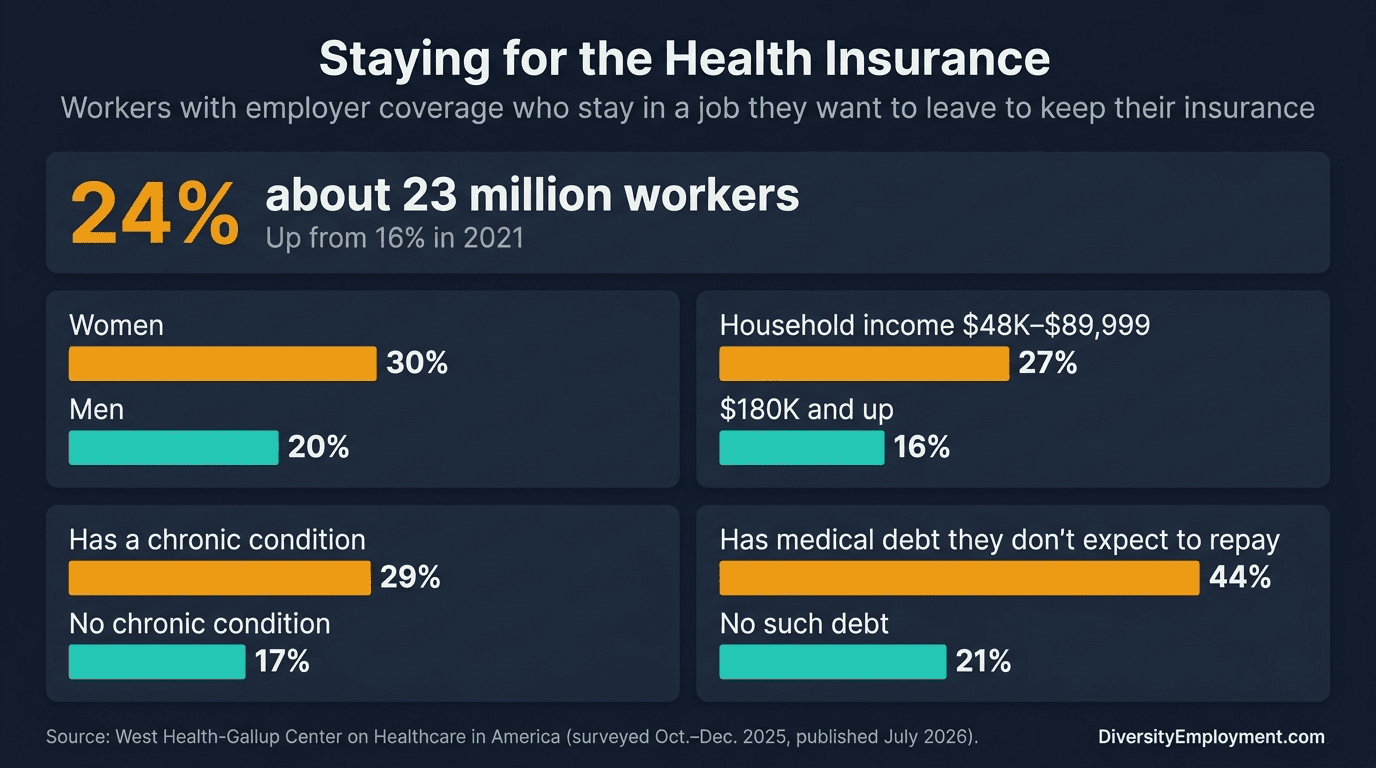
Pay and benefits usually get lumped together, but health insurance deserves its own spot. A West Health-Gallup study published in July found that 24% of workers with employer-sponsored coverage, about 23 million people, are staying in jobs they want to leave because they’re afraid of losing their insurance. In 2021, that figure was 16%.
The lock isn’t spread evenly. It falls hardest on the people with the least room to take a risk:
- Women: 30%, versus 20% of men
- Middle incomes: 27% in households earning $48,000 to $89,999, versus 16% at $180,000 and up
- Chronic conditions: 29%, versus 17% for workers without one, rising to 41% for people with three or more diagnoses
- Medical debt: 44% among workers carrying medical debt they don’t expect to repay, versus 21% without
Then there’s the 36% who just can’t give up their schedule. That’s where a lot of your caregivers are, the employees whose flexibility is the only reason a parent’s appointments or a kid’s pickup still work.
The Freedom Mirage
We’ve written about how rarely company policy fits those employees in The Caregivers Your Policy Doesn’t Cover. For many of them, “Could I even get this schedule somewhere else?” has one realistic answer, so they don’t even bother asking.
Put all of it together, and the employees you’re most likely to mistake for loyal are the ones with the least freedom to prove otherwise. At Diversity Employment, we’ve noticed that low turnover in a group like that usually says more about the group’s options than about how the company treats them.
Locked Isn’t Loyal
It would be convenient if trapped employees at least worked harder to protect the jobs they can’t afford to lose. But the research mostly points the opposite way. Organizational psychologists use “reactance theory” to explain it. When people feel their freedom is in jeopardy, they tend to push back instead of complying, and at work that shows up as lower effort and more subtle rule-bending.
The cost can be surprisingly concrete. A 2020 study in the Journal of Managerial Issues followed employees at two organizations for about two years and found that 41.5% were reluctant stayers, the largest of the four groups the researchers identified. In the fundraising division they tracked, reluctant stayers brought in about $1 million less per year than colleagues who stayed because they actually wanted to.
It’s Not Just Employees
It spreads, too. A 2024 study in the Journal of Organizational Behavior looked at leaders who stay reluctantly and traced the effects all the way down to the performance of the people reporting to them. A manager who wants out just doesn’t coach, sponsor, or fight for anyone the way an invested one does. We covered what happens when managers happen to stop doing that work in Why Some Managers Burn Out and Others Just Stop.
Gallup’s researchers describe the big picture plainly. When workers can’t leave, the discontent that would normally walk out the door stays inside the organization instead. It drags on productivity, morale, and culture, and it never shows up in your turnover reports.
The Not-So-Obvious Pay Cut
Some of your retention is also being paid for by the same people doing the staying.
In ADP’s August payroll data, base pay for workers who stayed with the same employer rose 3.0% over the year. Inflation for the same period ran 3.4%. That’s a small, but real, pay cut for the typical stayer, in a year when they didn’t go anywhere. Workers who changed employers saw base pay rise 4.7%, comfortably ahead of prices. ADP’s lead data scientist, Liv Wang, also noted that pay growth for lower-paid workers has lost momentum and is now slower than it was before the pandemic.
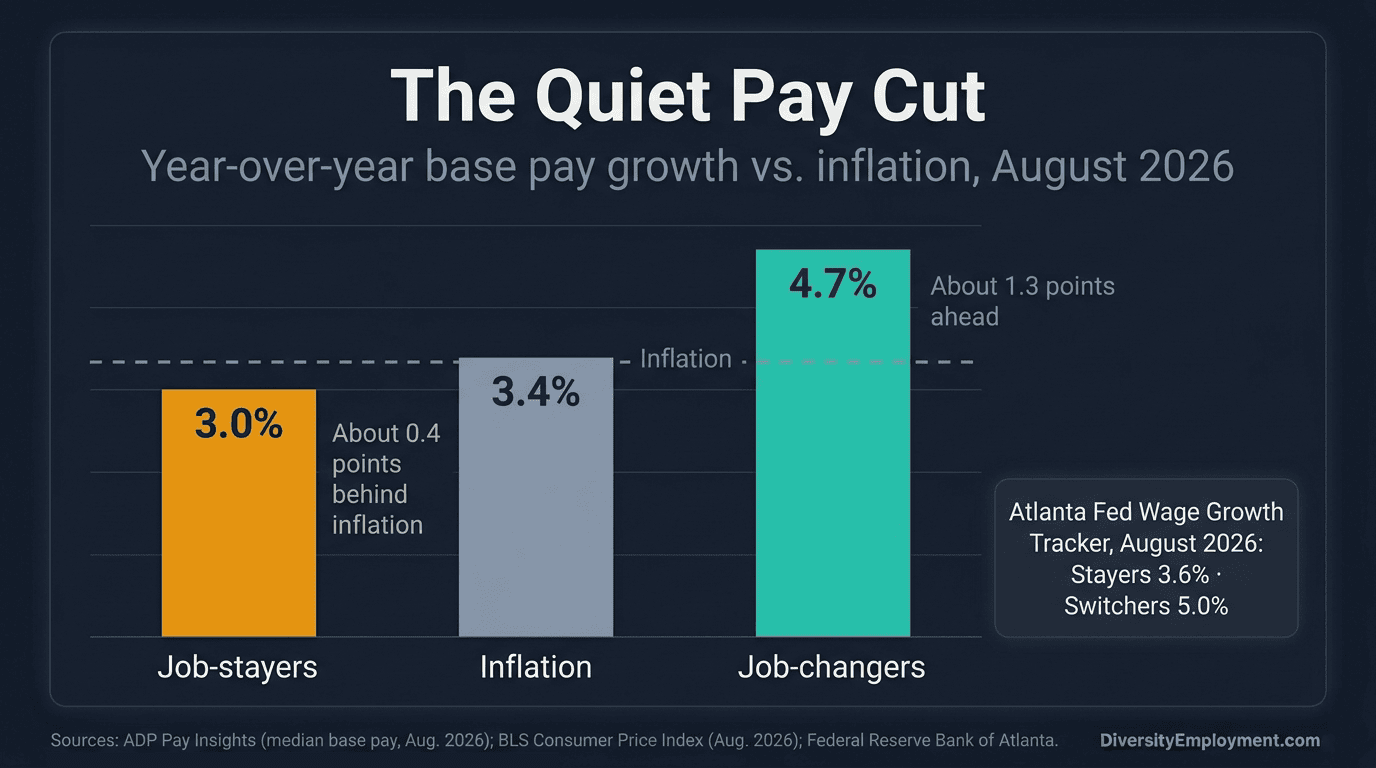
Comparisons to inflation calculated by DiversityEmployment.com
For a while, staying actually paid better. The Atlanta Fed’s Wage Growth Tracker showed job stayers out-earning job switchers for most of the first half of 2025, the first sustained reversal of its kind since the Great Recession era. Employers who stopped worrying about competitive raises around then weren’t wrong, exactly. Leaving didn’t pay.
They’re Looking for More Money
That’s changing. In August, the Atlanta Fed’s tracker put wage growth at 3.6% for stayers and 5.0% for switchers. The numbers are bumpy month to month, so one reading isn’t necessarily a trend. Still, the reward for leaving seems to be back, and the people who notice first will be the ones with the most options.
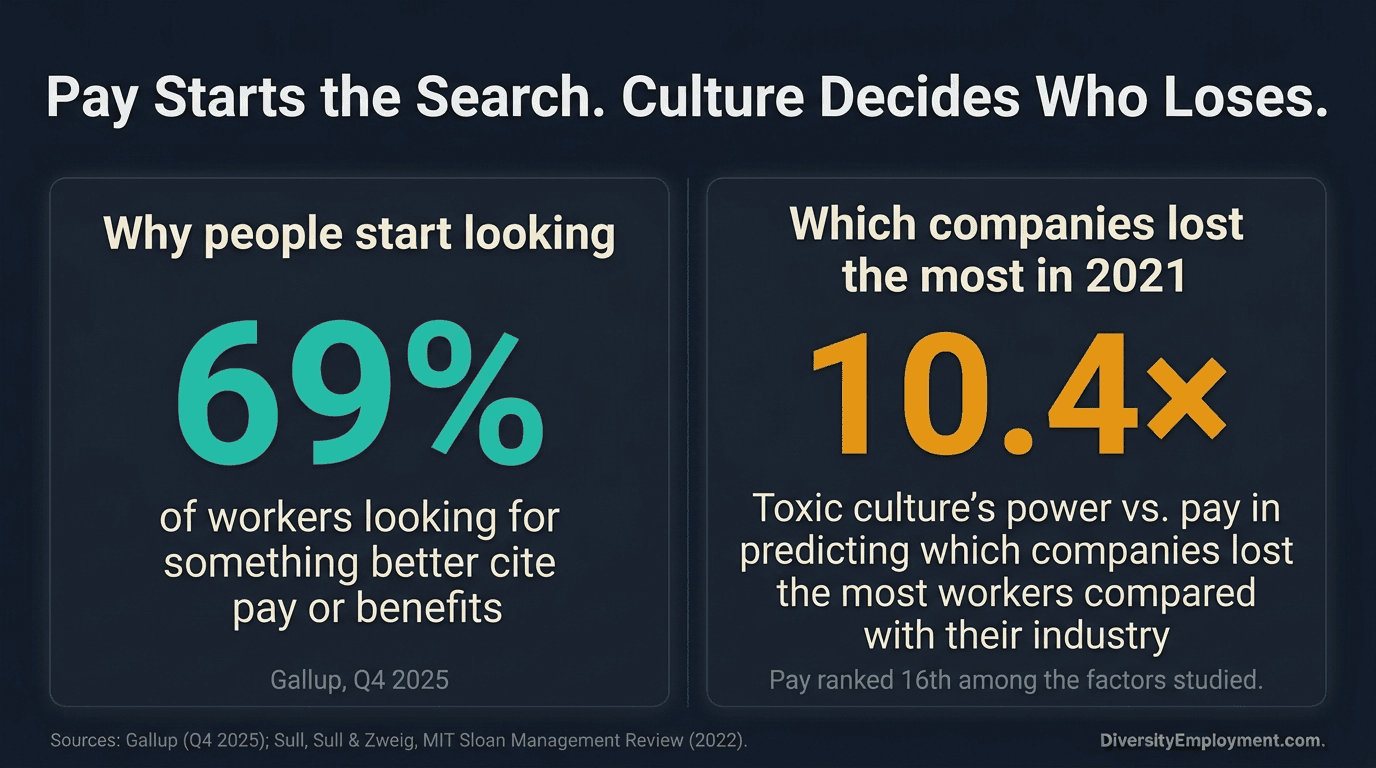
Gallup found that between workers looking for something better, 69% named pay or benefits as a top reason, way ahead of anything else. Every quarter a stayer falls behind the market is just another reason they’ll leave when they finally can.
What a Thaw Actually Looks Like
Most warnings about “job hugging” end with the same prediction: When the market loosens, everyone leaves at once. That could happen. History offers more than one version, though, and the difference matters for how much time you have.
Drip or Flood
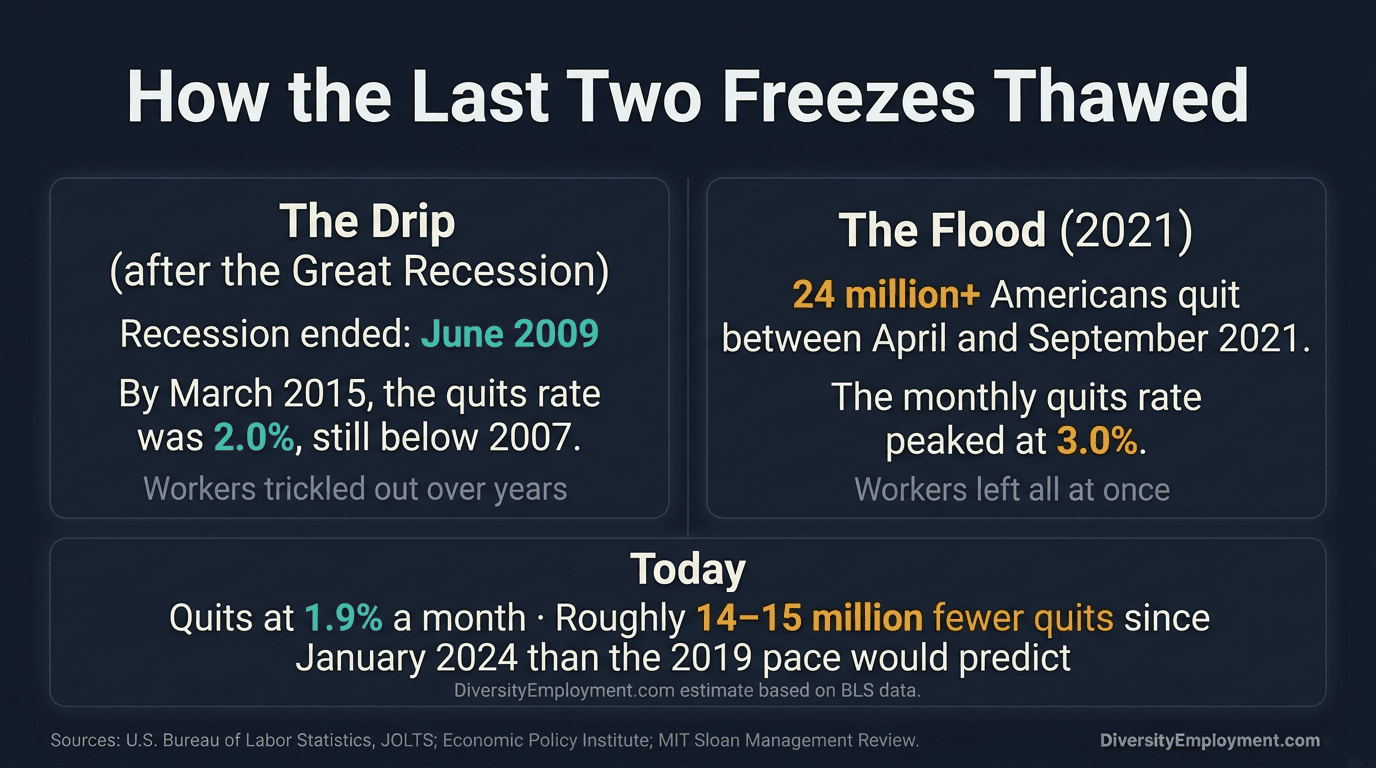
The last long freeze thawed slowly. The Great Recession officially ended in June 2009, and quits didn’t bounce back with it. By March 2015, almost six years later, the quits rate was 2.0%, still below where it had been in 2007. That’s the drip: workers trickling out over years as hiring gradually returned.
The 2021 thaw was a flood. Between April and September of that year, more than 24 million people quit their jobs, a record at the time, and the monthly quits rate peaked at 3.0% twice before it started falling.
Different Than the Past
Today’s freeze looks different than both those scenarios, because workers aren’t stuck from losing their jobs. They’re stuck because employers have stopped hiring. That barrier could lift faster than mass unemployment did in the 2010s, since all it takes is companies deciding to hire again. But for now, there’s no sign of that. Indeed’s Job Postings Index was hovering just under 2% above its pre-pandemic numbers in August, and Indeed Hiring Lab’s Sneha Puri wrote that the next few JOLTS reports are unlikely to look much different. That’s your window.
Plenty of movement is backed up behind it. If people had kept quitting at their 2019 pace, there would have been about 14 to 15 million more quits since the start of 2024 than actually happened. That’s our own rough calculation from BLS data, though. Some of those people have adjusted, retired, or made peace with staying. Still, it gives you a sense of scale for what’s waiting.
Who Goes First
Whenever the thaw comes, it won’t release everyone equally. The first people out are usually the ones with the most options, which tends to mean younger workers and people in in-demand positions. That’s the 61% of Gen Z already looking or watching, and the college-educated workers who’ve been the most pessimistic and are likely the most pent-up.
There are early hints about where it could start:
- Lower-income workers are getting restless first. The New York Fed’s August consumer survey found workers’ expected chance of quitting within a year rose to 19.5%, above its 12-month average, and the increase came mostly from people with a high school education or less and household incomes under $100,000.
- AI-exposed jobs are moving again. Indeed found that AI-exposed occupations, which led the decline in job postings starting in 2022, led the rebound over the past year.
- Manufacturing is posting again. The industry whose quits fell the most added 152,000 openings year over year, second only to retail.
None of that implies a rush is coming next month. It means the thaw will probably reach certain teams long before other ones.
Pay Drives the Looking. Culture Decides Who Loses.
The last thaw left one useful lesson about who got hit hardest. When researchers writing in MIT Sloan Management Review analyzed which large companies lost the most employees compared with their own industry during 2021, pay barely registered. It ranked 16th among the factors they studied. A toxic culture was 10.4 times more powerful than compensation at predicting that relative attrition, driven by things like workers feeling disrespected and even unethical behavior.
That fits with Gallup’s finding that pay is the top reason people start looking. Pay is what gets people browsing. Culture is what decides whether your company loses them faster than the one down the street. When quits rise again, they’ll rise everywhere, and the test that counts is the market-adjusted one: Whether you lose people faster than your industry does.
What to Do While the Window Is Open
A frozen market is the best time to fix retention problems, because nobody’s leaving while you work on them. Each of these targets something your turnover report can’t see.
- Market-adjust your turnover number. Run the industry comparison at least once a year, and report it next to your raw turnover so leadership sees both. A retention rate without a benchmark is just noise on paper.
- Ask the question directly. Gallup found that 42% of people who quit said their employer could have kept them, and 45% said nobody talked with them about their job in their last three months. In reports/interviews, ask things a potential reluctant stayer can answer honestly: “If a comparable job opened up tomorrow, would you look?” – “What’s the main thing keeping you here?” – “Would you take this job again?”
- Audit what stayers are really earning. Compare your raises to inflation and to what switchers are getting in your hardest-to-replace positions. Start with the people most likely to get an outside offer.
- Turn the lock into a reason. If your health plan or your schedule flexibility is what keeps people, that’s a genuine advantage. Talk about it, protect it, and keep investing in it, so it feels like something you offer on purpose.
- Fix the managers. Culture decided who lost the most in 2021, and people experience culture through their manager. Find your reluctant managers now, before their teams start updating résumés.
- Watch the signals. Track the Atlanta Fed’s stayer and switcher numbers, your industry’s JOLTS hires rate, and your own early warnings: like fewer internal applications, and less employee referrals. People stop recommending a place well before they actually leave it.
Earned or Rented
So, is it loyalty or fear? For a lot of your employees, it’s neither. It’s just math. It’s the insurance they can’t lose, the schedule that holds their family’s week together, or the pay they can’t risk on a search that might go nowhere.
That’s why your turnover number can’t answer the question on its own. Part of it is decided by the market, which froze around you. Part of it belongs to people who would leave if they could, and who are giving less and less while they wait. And part of it is being paid for by stayers whose raises haven’t kept up with prices.
Use the Time You Still Have
None of that will happen until the market moves. When it does, quits will rise everywhere, and the companies that get blindsided will be the ones that mistook a frozen market for a loyal workforce. The ones that come through fine will have used this window to find out which of their people were actually choosing to stay.
Low turnover feels great. The real questions are: “How much of it have you earned?” And “How much are you renting from the market that simply won’t stay frozen forever?”